
Product / Profitability
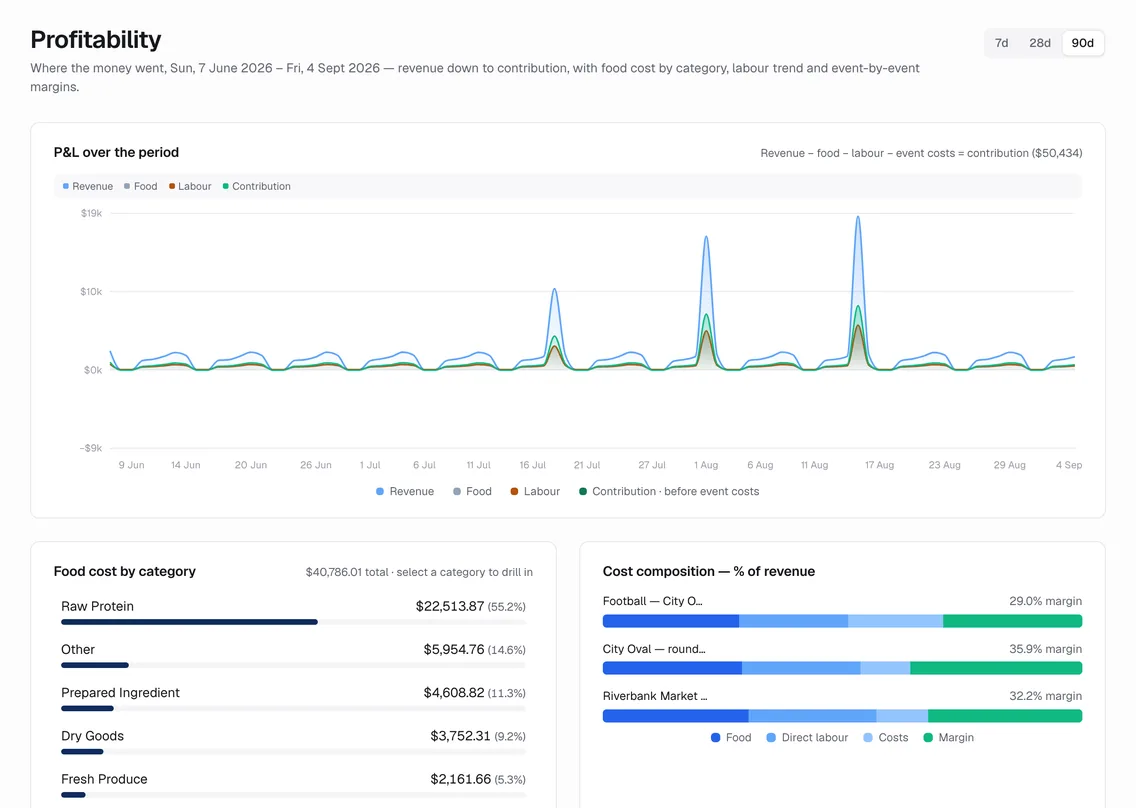
Revenue down to contribution, every day.
Sales, food, labour and event costs by day, by site and by event, and the contribution that is left. The dashboard is the ledger; the reports read from the same rows.
01
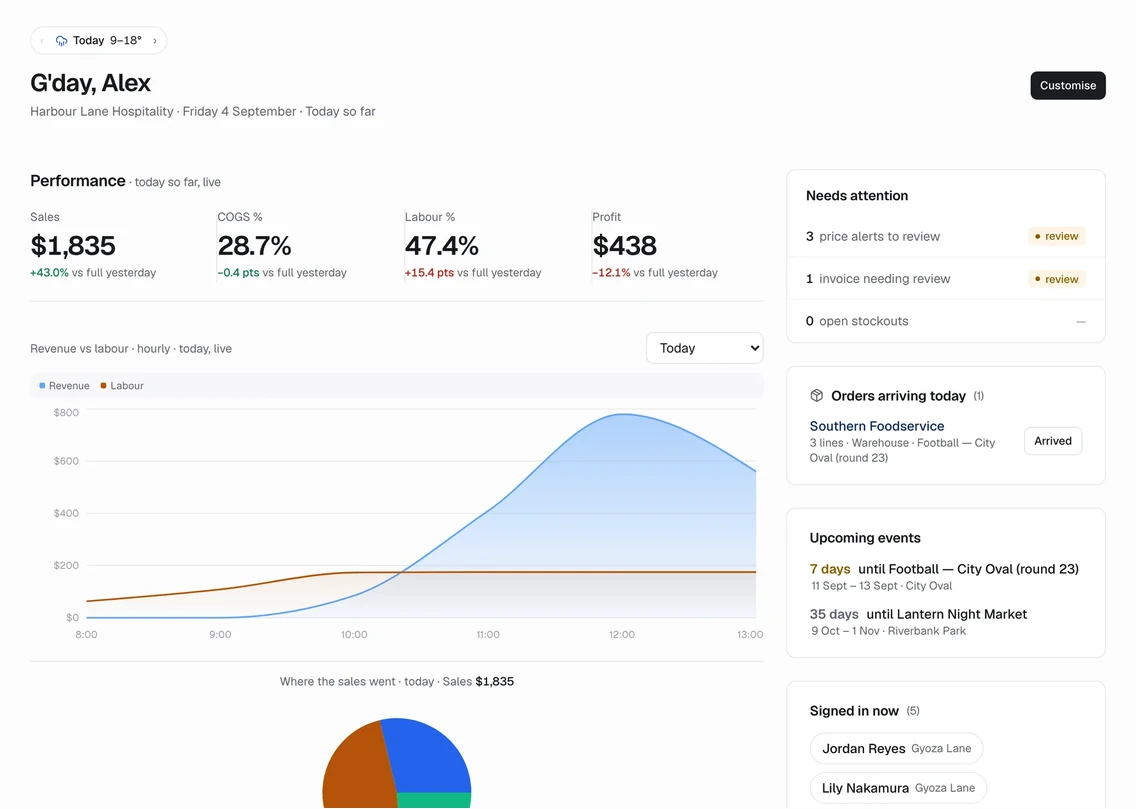
Home is a ledger, not a poster
Sales, COGS %, labour % and profit with period-over-period deltas, a daily revenue line that renders dark days as zero, and an attention strip for the alerts, invoices and stockouts that need a decision. Switch to Today and it is hour by hour, live, with the morning operating loss honestly in red.
02
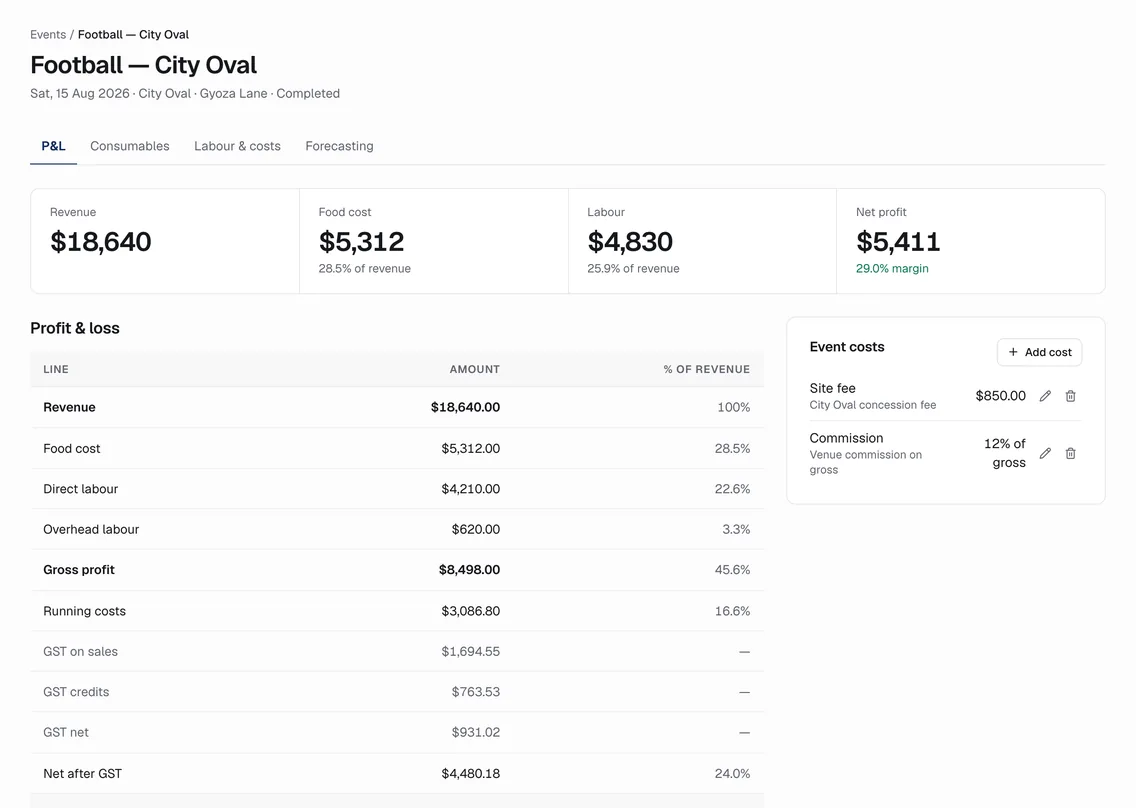
Each event is its own statement
Revenue, food cost, direct and overhead labour, gross profit, running costs, the GST lines and net profit, per event, with the event costs you add in a rail beside it. Direct labour comes from approved timesheets once posting is enabled, never from estimates.
03
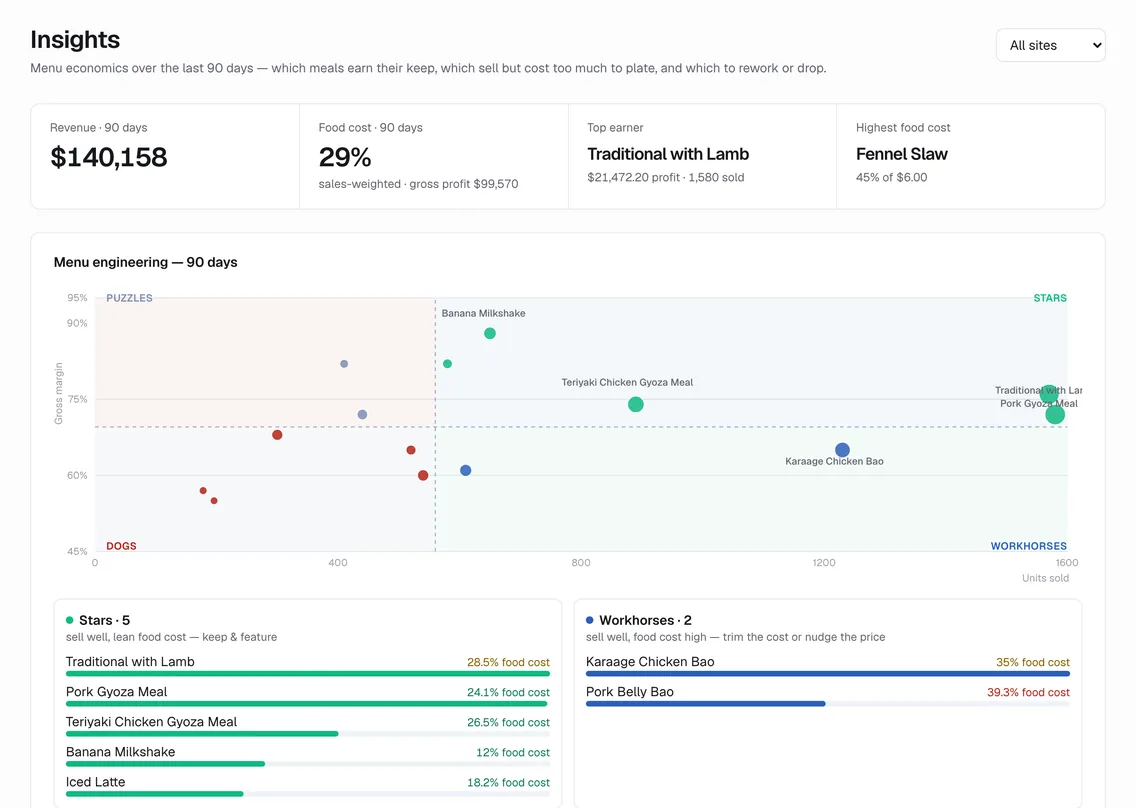
Menu engineering from real sales
Ninety days of per-site economics place every meal in one of four quadrants: stars, workhorses, puzzles and dogs. The top earner and highest food cost are named. Reports cover sales, food, labour and profit by day, brand and event, with a bounded analyst that reads the same rows you see, when enabled.
How it works
The rules behind it.
- One number
- Contribution = revenue − food − labour − event costs, everywhere it appears
- Honest axes
- Period charts plot the full calendar; dark days are zeros, never compressed away
- Two zoom levels
- Badges round to whole percent; tables and detail views keep one decimal, from the same fact
Also in the product
See it on the demo venue group.
No sign-up. Change anything. It only changes for you.